
Written by: Angela Akers
Third quarter earnings season began in earnest last Friday with upbeat earnings from JPMorgan Chase and Wells Fargo and fully bloomed this week as Goldman Sachs, Citigroup and Bank of America followed suit, beating on both the top and bottom lines. All lending support to the economic soft landing the Fed is working to achieve. Tawain Semi released earnings this week as well. Their bullish forecast for “many years” of AI demand and an earnings win bodes well for Q3 tech earnings. Netflix experienced a beat on the top and bottom line as well as they announced they’ve added more subscribers than expected (Note: NFLX is not expected to release these figures until Q1 2025). Accumulatively, all looks good and calm so far for Q3.
In fact, according to FactSet, 14% of S&P500 companies have reported their Q3 2024 results with 79% beating their earnings estimates and 64% reporting revenues above estimates. Additionally, as of tonight, our Market Climate Graph shows that the 50-Day MA of the VV S&P500 WatchList Average EPS rose $0.03 per share to $10.20 per share, while forecasted average earnings growth remained unchanged at 9%/yr. The Market Climate Graph shows that the Earnings Trend Indicator, ETI, also remained unchanged at a level of 1.09. Since it remains above 1.00, earnings are trending higher, and the market is in a Bull Market Scenario.
My inclination is that the trend of an upbeat Q3 will continue, but there is no guarantee and not every company is going to be a winner. Therefore, it is important for investors to be informed and prepared in case of an earnings miss on one of their holdings and there are a few ways that VectorVest can help.
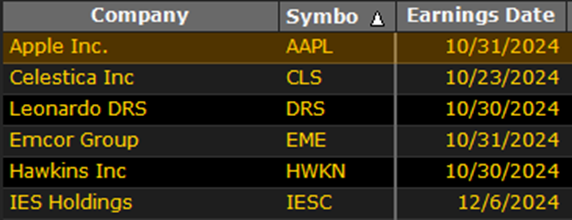
First, to stay informed, it’s important to be aware of when the stocks you own are reporting earnings. Therefore, you can add the earnings date directly to your Portfolio Layout by right clicking on any of the stocks in your Portfolio, select Layout, find Earnings Date in the Field List and move it to the Grid. From there, you can position it where you’d like and click ok. I personally like to move the Earnings Date next to the symbol (sample as shown below) so that the earnings date is top of mind.
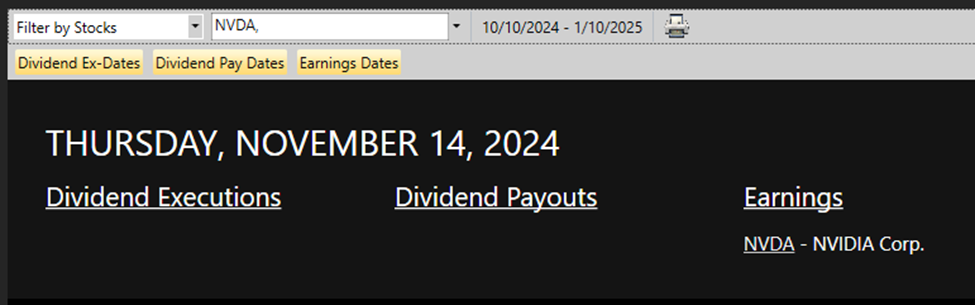
Secondly, with any stocks that you are considering buying during earnings season, it is important that you know when they are reporting. Aggressive investors might want to make an ‘earnings play’ and buy a stock before it reports if they believe the stock is going to beat earnings so they can experience potential gains. To check on the earnings date, click on Viewers, then Events Viewer. By default, it shows you the Earnings by date. To find the date for a particular stock, select the dropdown arrow next to View All Stocks and select Filter by Stocks and type in the symbol. The Events Viewer is conveniently set to the upcoming quarter.
Lastly, you can learn more about options. Why? If you suspect a stock that you own may experience an earnings miss, but don’t want to sell the stock, you can protect yourself against the downside movement by buying a protective put or selling Covered Calls. If you’re not familiar with these techniques, the VectorVest University offers a FREE Options Foundation Course that will teach you the basics and get you started.
While we’re on the subject, if you already have some experience with Options, but you’re interested in stepping up your options game and trading options for income, not just for protection, consider our upcoming Options Paycheck Experience.
Incidentally, in last week’s Essay, I reported that FactSet was expecting earnings growth of 4.2% for Q3. Subsequently, I read another article from FactSet which stated, “Based on the average improvement in the earnings growth rate during the earnings season, the index will likely report year-over-year growth in earnings above 7% for the third quarter.” The trend of lowering expectations going into earnings season and raising expectations after it begins continues. Remember, VectorVest’s Q3 estimate is 8%. Trust VectorVest.


Want These Types of Insights at Your Fingertips so You Can Win More Trades?
Use VectorVest to analyze any stock free. VectorVest is the only stock analysis tool and portfolio management system that analyzes, ranks and graphs over 18,000 stocks each day for value, safety, and timing and gives a clear buy, sell or hold rating on every stock, every day.
Before you invest, check VectorVest! Click here to ANALYZE ANY STOCK FREE and see our system in action!


Leave A Comment