
Written by: Angela Akers
Analysts have been calling Nvidia (NVDA) the “most important stock in the world right now” and the earnings report was touted as the “most important earnings call” of the quarter. It’s not surprising because the AI boom that has occurred over the past several years has been led by NVDA. The first three trading sessions of the week were haunted by what the results would show. Nvidia had blockbuster earnings for the third straight quarter, but the forward-looking expectations, although better than anticipated, somehow managed to disappoint. In my humble opinion, the market’s reaction was unwarranted.
All the AI tech talk this week reminded me of an Essay I wrote back on February 3, 2023 entitled, “Big Winners In AI,” where I introduced a WatchList called AI Stocks and ETFs (found in the Overview WatchLists group). I reviewed the results produced from sorting that WatchList by the various VectorVest Proprietary Indicators, highlighting how easy it is to find those big winners in AI. With AI prominently in the news this week, I thought it would be interesting to update the results of the QuickTests shown in that Essay.
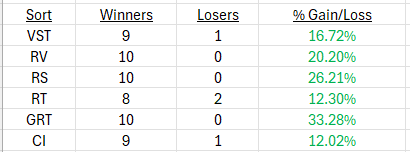
As a reminder, these are the results as of February 3, 2023, almost 19 months ago:
Here are the results from the start date shown in that Essay, January 9, 2023, through last night’s close:
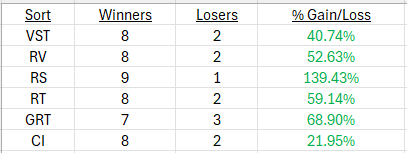
During the same period, the Price of the VVC rose by 24.93%. So, five of the six proprietary sorts not only beat the market (as represented by the VVC), but beat the market by a wide margin. Phenomenal, right? But let’s see what else we can do.
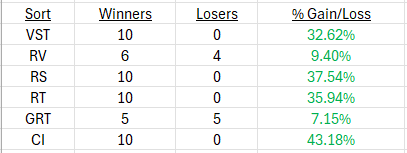
To further showcase the efficacy of the VectorVest indicators, I ran two other QuickTests on the AI Stocks and ETFs WatchList; one from August 29, 2023 (one-year lookback) in which the VVC rose 17.10% and another from December 29, 2023 (YTD lookback) in which the VVC rose 10.68%.
Here are the results from the August 29, 2023 start date:
And the December 29, 2023 start date:
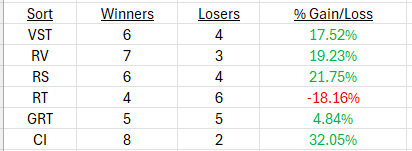
During both the one-year test and YTD test, four of the six proprietary indicators beat the market. Incredible.
As illustrated in these tests, it is not just luck or a coincidence, but the power of the VectorVest proprietary indicators that sets VectorVest subscribers apart from the average investor. Use the indicators alone or in concert with each other, based on your risk tolerance, to help you make better investment decisions. Why would you want to be average, when it is so easy to Be Exceptional.
PS. I’m not surprised that my personal favorite, Relative Safety, RS, managed to beat the market by a hefty clip in all three cases above. In this week’s “Special Presentation,” Mr. Ron Wheeler will explain why the VectorVest Relative Safety indicator is an integral part of building a winning portfolio, especially when facing market volatility.


Want These Types of Insights at Your Fingertips so You Can Win More Trades?
Use VectorVest to analyze any stock free. VectorVest is the only stock analysis tool and portfolio management system that analyzes, ranks and graphs over 18,000 stocks each day for value, safety, and timing and gives a clear buy, sell or hold rating on every stock, every day.
Before you invest, check VectorVest! Click here to ANALYZE ANY STOCK FREE and see our system in action!


Leave A Comment