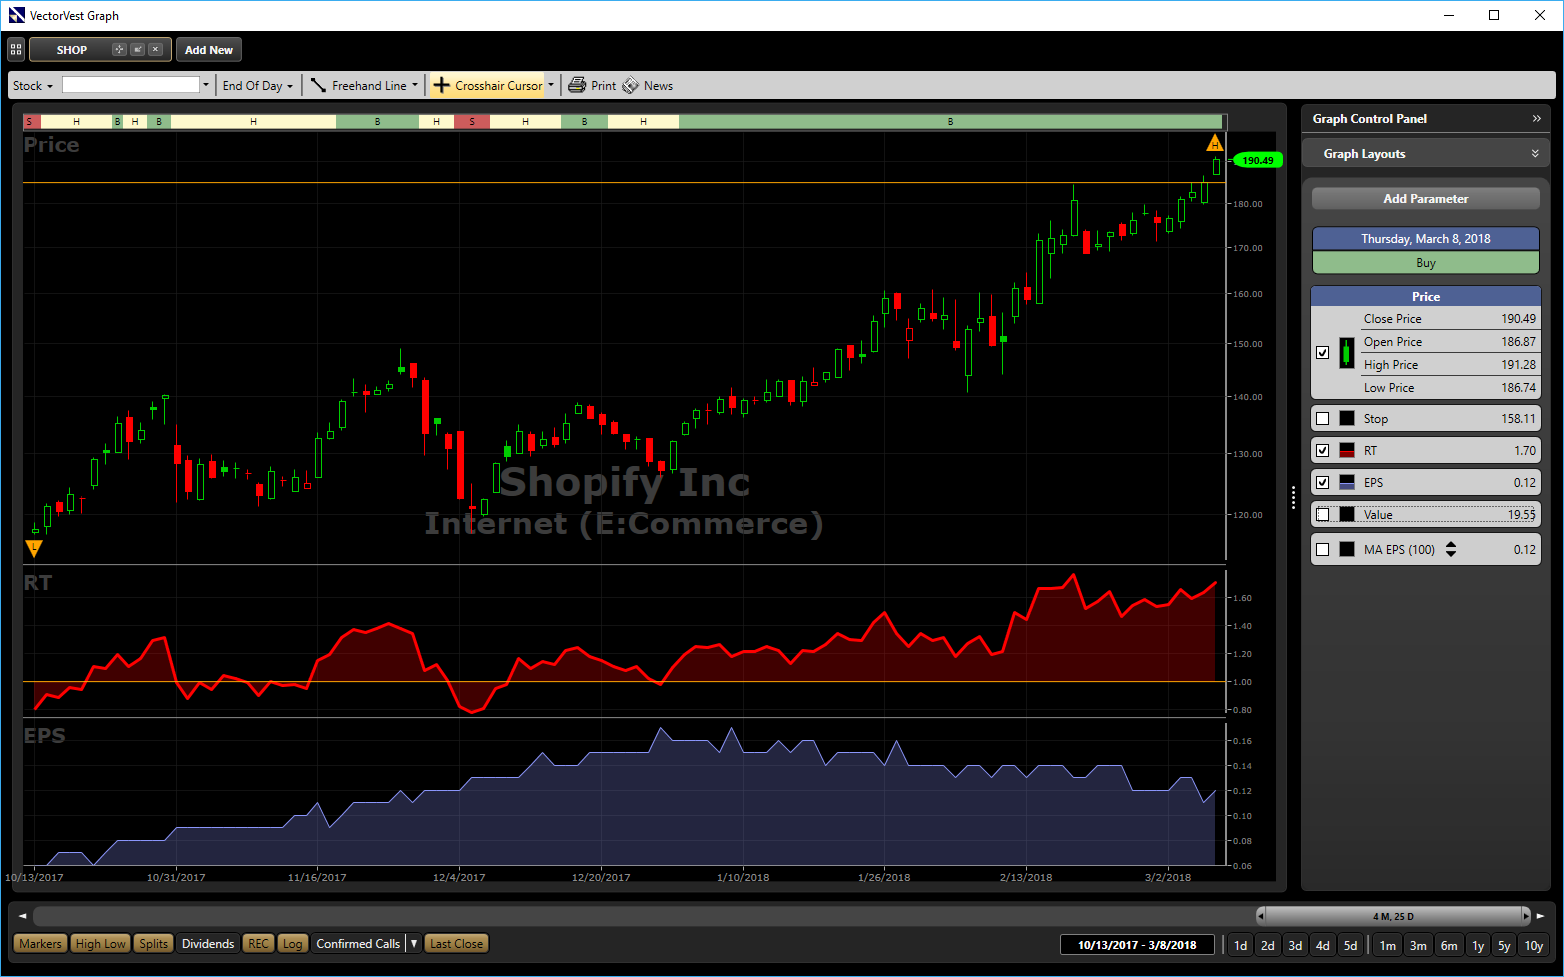
The ability to read a stock graph is arguably the most important investing skill you will ever learn.
VectorVest’s Founder Dr. Bart DiLiddo says that a stock’s price pattern is like its DNA. “Its past behavior reveals what you should expect in the future.” It cuts through all the rumours, headlines and hype to paint an objective picture of where price has been, and where it is heading now.
VectorVest’s graphs are vibrant, easy to read and easy to navigate. There’s no limit to the extent and type of analysis you can do using VectorVest graphs. You can keep it simple, displaying price, a 40-day MA, earnings and volume, or you can dive into technical analysis by adding technical studies such as Support & Resistance, MACD and Stochastics. Eleven of the most popular technical studies are included with your software, plus you can customize them to suit your trading style.
Here are my Top 5 Favourite Things About VectorVest Graphs.
- I love Candlesticks, especially VectorVest’s Candlesticks. They give me so much information. Vibrant red and green Candlesticks on a black background are readable and visually stimulating. The colour of the Candlestick, the size of the body and the wicks, whether it’s filled or unfilled, gives us valuable information at our fingertips. We can choose OHLC, Area or Line graphs, but it’s Candlesticks for me most of the time.
- Earnings, Value and Other Key Indicators. Consistent and predictable earnings is what ultimately drives share prices higher. Is Earnings rising or falling? Is Value rising or falling? The ability to graph forward-looking EPS and Value gives subscribers a distinct advantage. We can also graph annual Dividends, one of my favourite methods for finding dividend growth stocks. In fact, we can graph any VectorVest indicator whether its part of Capital Appreciation, Dividend Analysis, Price/Volume, Sales/Market Cap or a custom indictor that we create ourselves. Try adding %Vol Change to your graph. You’ll love it.
- Best Fit. This is a unique VectorVest feature that is designed to always give you a highly readable, great looking graph. It determines the size of the graph and number of Candlesticks from the size of your computer screen. It’s fantastic for Intraday graphs, but it works the same with all frequencies. You select the frequency, click on Best Fit and you get a beautiful, readable graph.
- Weekly Graphs. We have the standard End of Week graph which displays information from the last trading day of the week. But, we also can choose a Weekly Graph which displays data for the entire week in a single Candlestick or OHLC bar. This reveals a huge difference in appearance and gives the investor additional valuable information. It’s fantastic!
- Moving Averages and Trendlines. It’s so easy to add moving averages to our graphs, including simple, exponential and weighted. What’s really special is that we can apply a moving average not only to price, but to virtually every key indicator that we have in the program including the Stop Price, RT and Volume. It’s also easy to draw trendlines, my favourite being the Extended Line. It’s a trendline that keeps going to the right edge as each new trading day passes.
It was difficult to narrow this list down to the Top 5. I had to leave for another time features like MultiView to display four graphs within one window for quick comparison; the default graph layouts including Star Search, ProTrader Timing DEW and Midas Touch; the Industry, Sector and Performance graphs; MiniGraphs that we can add to our Home Page and Dashboard; and of course, the most important graph in the program, the Market Timing Graph.
If you would like to learn about the full range of capabilities and features of VectorVest graphs, visit the VectorVest University from the Training tab, click on General Training/VectorVest 7, and select Graphs. If you need additional help, please don’t hesitate to call our wonderful Product Support Team at 1-888-658-7638. Finally, let me know next Tuesday at our weekly Q&A, what are your TOP 5 FAVOURITE THINGS ABOUT VECTORVEST GRAPHS?
Create your own custom graphs, try VectorVest for 30 days, only $9.95!


Leave A Comment