FREE Q&A WEBINAR TOMORROW, MONDAY, DEC 15 AT 1:00 P.M. Eastern Time
Click to register:
http://news.vectorvest.com/CA_SOTW_QA_121514_registration.html
 VectorVest’s Strategy of the Week Friday describes an easy yet effective strategy for picking top stocks in industry groups that are exploding up in a rising market.
An industry group or sector consists of companies in closely related businesses such as airlines, insurance, utilities and petroleum for example. The difference between a sector and industry group pertains to their scope. A sector refers to a large segment of the economy and is typically comprised of at least two or more industries. As such, an industry group is a sub-set of a sector. It is typically comprised of at least two but more frequently several companies that have similar business interests.
Institutional managers track industry groups closely to determine which sectors are cooling down, and which ones are heating up. Once a sector or industry group ‘rotates into favour’, one institution after another begins accumulating shares in the best companies in the group. As more money flows into the group, the best companies become fully valued and the sector starts to cool off. As well, economic conditions for the group may have weakened, another factor that can cause stock prices in the group to fall. Petroleum and Mining are the most obvious recent examples. So whether the reason is stocks are overvalued or the group’s economic conditions has changed, eventually every group at some point becomes overpriced and money rotates into the next hot sector.
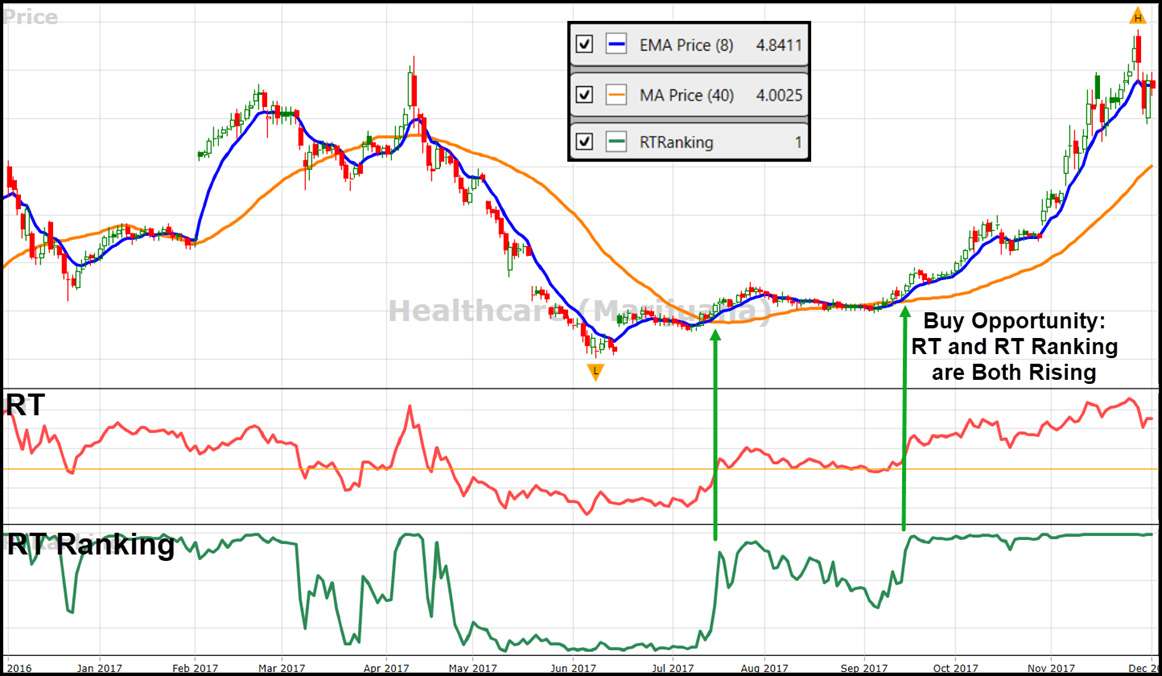
A popular investment strategy is to pick the strongest stocks in the strongest industries when the industry group is rising or ‘rotating back into favour’. But how do you find the industries that are rising the fastest and also their best stocks? Friday’s SOTW presentation titled, Keeping Track Of Explosive Industry Group Rotation explained how easy it can be using VectorVest. We simply use the Industry Delta Viewer.
For Market Timing, simply wait for a green light or at least a primary wave up after the MTI (market timing indicator) begins to rise after falling below at least 1.0 (0-2 scale). The farther MTI has fallen, the more explosive the rebound is likely to be. Open the UniSearch tab and run the ‘5-Day Industry Delta’. Make sure you Sort Descending. In the viewer you will see the industry groups with the largest percent gain in Relative Timing (RT) over the previous 5 trading days. RT is a smart indicator that gives us the direction and magnitude of the current price trend.
Now that you have found the industries that are moving back into favour the fastest, make sure your stocks are moving up also. They should also have good Relative Value (price appreciation potential) and be reasonably liquid. All of these conditions are easy to set up you your UniSearch scan, allowing you time to check your industry and stock graphs as a final measure.
Once again, I hope you will join me tomorrow, Monday, December 15 at 1:00 p.m. ET for our weekly market update and Q&A webinar. I’ll show you how you can automate your industry rotation tracking by adding a few lines of criteria to the UniSearch criteria. I’ll also show you some pretty interesting results from some backtesting I’ve been doing this weekend using instructor Jerry D’Ambrosio’s techniques but modified for our Canadian market. Register from Friday’s Views tab or just click on the link below to register for our webinar: http://news.vectorvest.com/CA_SOTW_QA_121514_registration.html

Hi Stan,
Thx for the latest work on industry groups. I wanted to advise you that I couldn’t do the quickee camera capture of the unisearch industry rotation criteria tracking that you showed us in the webinar; don’t know what I am missing but it didnt work. I can certainly go back to the webinar and do a printscreen copy of the computer screen or even a written copy – but a printscreen copy or microsoft word copy of the criteria published by you might be useful for other users. Again, thanks for your good work.
Cheers,
Ryan from Comox
Hi Ryan, Thanks for your comments. I’m planning to do another short random video that will show the industry group rotation search. The purpose of the video is actually to show how to run a “manual backtest” for subscribers who do not have the Autotester Genius. Even for those who have the Genius, there are some real advantages in running a manual test. It’s easy to do and not too time consuming unless you want to test over a real long period, great than one year for example. Regarding the camera capture during a webinar, the issue may be that you do need to have the screen ‘minimized’ in order to see the camera icon. From there, once you click on it, it should save the screen image automatically to your desktop. Thanks again Ryan.