Written by: Angela Akers
A softer core Producer Price Index reading sparked a rally Tuesday, but an expected reading on Consumer Prices didn’t have the same, desired effect Wednesday and prices closed only modestly higher. Better-than-expected Retail Sales soothed investors’ fears on Thursday, and they began buying again. After several weeks of red and yellow lights, we saw our first green light in the Price column of the Color Guard this week. Therefore, the question comes to mind, if the market continues to rise and there is follow-through to the upside, what stocks would I buy?
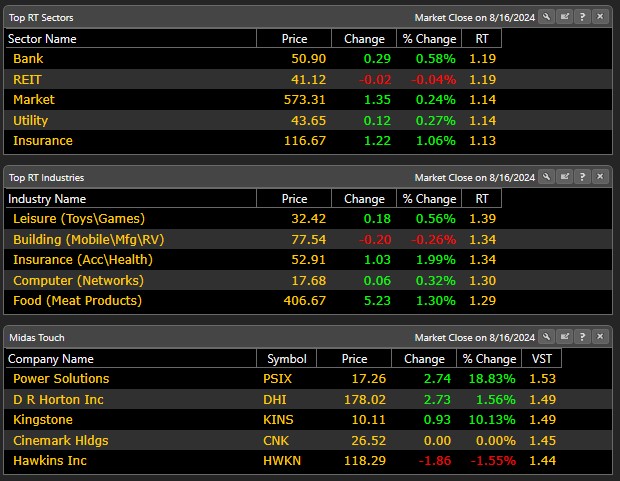
Last week, I said, “When the Color Guard signals and it is time to replace those low VST, S-rated stocks that you sold, you don’t have to look too far, just Exploit the Home Page. On the Home Page, you will find the fastest moving Business Sectors and Industry Groups. Buying rising stocks in rising Business Sectors and Industry Groups adds another essential layer. You’ll also see the Top 5 Midas Touch stocks and the Top Trading Systems ranked by 1 Month % Gain/Loss (showing you the Trading Systems that are working right now).”
Hence, there are many options. However, at our core, VectorVest advocates buying safe, undervalued stocks, rising in price when the market is rising. You may wonder, what exactly does that mean? Let’s break it down by relating it to the VectorVest proprietary indicators.
In VectorVest, safe stocks are those that have had consistent, predictable financial performance, debt to equity, sales volume, business longevity, price volatility and other fundamental factors. They are stocks that have a Relative Safety, RS, rating above 1.00 on a scale of 0.00 to 2.00. The higher above 1.00 the RS is, the safer the company is. To find the safest stocks in VectorVest, ie., the companies that have grown their earnings year-after-year, just sort the Stock Viewer by RS Desc. Bingo! Here you have the safest companies your money can buy.
Undervalued stocks are those stocks that have a Price less than their calculated Value. VectorVest calculates the intrinsic Value of a stock. In other words, what a stock is really worth based on their fundamental profile of forecasted earnings per share, forecasted earnings growth, profitability, interest and inflation rates. In addition, there is another proprietary indicator that plays into the “undervalued stocks” part of VectorVest’s belief statement and that is Relative Value, RV. It is far superior to a simple comparison of Price and Value, and only found in VectorVest. RV is an indicator of long-term price appreciation potential that is computed from an analysis of projected price appreciation three years out, the AAA Corporate Bond Rate and risk. It is also based on a scale of 0.00 to 2.00 with ratings above 1.00 being favorable. To find the most undervalued stocks in VectorVest, sort the Stock Viewer by RV Desc.
To identify stocks that are rising in price, check their Relative Timing, RT. RT is computed on a scale of 0.00 to 2.00 from an analysis of the direction, magnitude, and dynamics of a stock’s price movement day-over-day, week-over-week, quarter-over-quarter and year-over-year. “Rising in price” means finding stocks whose RT rankings are trending higher. A stock is in an uptrend if RT is above 1.00. As the uptrend dissipates, RT will gravitate toward 1.00 again.
Our master indicator, VST, combines the three indicators above, RS, RV and RT, and is computed from the square root of a weighted sum of the squares. Stocks with the highest VST ratings have the best combination of Value, Safety and Timing. The Stock Viewer, which by default is sorted by VST Desc, is designed to automatically bring these stocks to your attention first.
After the market has experienced a sharp pullback, as has happened over the last several weeks, VST Vector is a great place to go to look for stocks to buy. Moreover, if you want to find more focused ways to find these safe, undervalued stocks when they are just starting to rise in price, please join Dr. Glenn for this week’s “Special Presentation” and he will show you how to find The Best Stocks At A Better Price.
Want These Types of Insights at Your Fingertips so You Can Win More Trades?
Use VectorVest to analyze any stock free. VectorVest is the only stock analysis tool and portfolio management system that analyzes, ranks and graphs over 18,000 stocks each day for value, safety, and timing and gives a clear buy, sell or hold rating on every stock, every day.
Before you invest, check VectorVest! Click here to ANALYZE ANY STOCK FREE and see our system in action!


Leave A Comment