 I hope you had the opportunity to view this week’s Strategy of the Week video. It was titled, 3 Steps to Retire with Peace of Mind. Brian D’Amico, our Manger of Educational Services, delivered a well thought out presentation with tips for how to get your portfolio unstuck, how to generate income from dividends and covered calls, and how to buy ‘insurance’ for your stocks using options. Please join me Tuesday at 12:30 p.m. EST for our weekly SOTW Q&A webinar. We’ll discuss Friday’s SOTW, study current market conditions and look for a few good stocks for some trade ideas. REGISTER HERE.
Update from last weekend’s Blog post.
Last weekend I posted, “The U.S. market appears to be set up for some profitable bottom-fishing for short-term gains.” I explained my 5-Step Method for spotting a Bottom-Fishing opportunity and taking advantage of it using VectorVest’s Derby and Bottom-Fishing searches.
So, if any of you jumped in Tuesday morning with the top five stocks from any of Friday’s 1-day Derby winners, all bottom-fishing searches, you would have made a nice return by the close Wednesday. If you did, it would be great to hear from you. What search did you choose? What stocks did you choose? When did you close out and what were your gains?
Below is results of how the top 1-Day Derby winners posted in Friday’s Views performed last week:
- Blyar’s Bottom Feeders/BMB – Up 8.16% at Wed. close; 8.01% at Th. close; and 1.52% at Fr. close.
- Pirates – Long – Up 13.16% Wed; 11.13% Th; 11.41% Fr.
- Silber’s Singles/BMB – Up 15.88% Wed; 24.35% Th; 21.06% Fr.
- S&P 100/RT – Up 4.74% Wed; 2.91% Th; 0.11% Fr.
- Russell 2000/RT – Up 8.64% Wed; 0.65% Th; 0.31% Fr.
The set-up wasn’t perfect for Canada, however, the top five 1-day winner Derby searches after Friday’s close all delivered solid gains last week. TSX Composite/RT was the best performer with a 14.40% gain from Tuesday’s open to Wednesday’s close; 11.44% to Thursday’s close and 9.22% if you held to Friday’s close.
The week ahead.
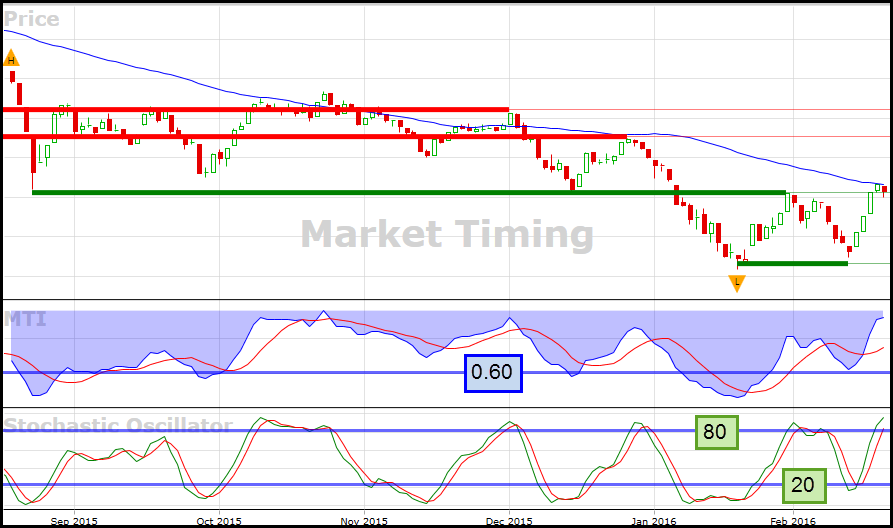
Canada’s market broke above a Wicked Wedge last week so we could see the rally continue, but the caution light is on because of resistance overhead. Our MTI graph (Market Timing Indicator) shows we are right at a resistance zone after Friday’s close. That resistance is shown in the graph below in three ways: 1. Price of the VectorVest Composite/CA is right at the 65-DMA. 2. We are at a support/resistance zone shown by the green line drawn by VectorVest; and, 3. Stochastics has moved above 80, an indication of an overbought market. Countering that resistance somewhat is that we had our fourth consecutive Primary Wave Up at the close Friday despite a 117 point decline in the TSX. We would like to see a break above the 65-DMA to have more confidence for a sustained rally ahead.
Presented by Stan Heller, Consultant, VectorVest Canada
DISCLAIMER: The information contained in this Blog is for education and information purposes only. Example trades must not be considered as recommendations. You should always do your own analysis and invest based on your own risk tolerance, investment style, goals and time horizon. There are risks involved in investing and only you know your financial situation, risk tolerance, financial goals and time horizon.


Excellent and very informative post. Really highlights how fortunate we are with Vector Vest Canada. Looking forward to another informative and beneficial Q&A on Tuesday